Dashboards in Azure DevOps
Dashboards are customizable interactive boards that provide latest and up-to date information about a project in Azure DevOps. A Dashboard can contain one or more widgets which can display various information about the workitems, repos, commits, build, release pipelines and testplans. This is very different from Boards which display only the workitem information and which is used for day to day tracking of the tasks, user stories in a project.
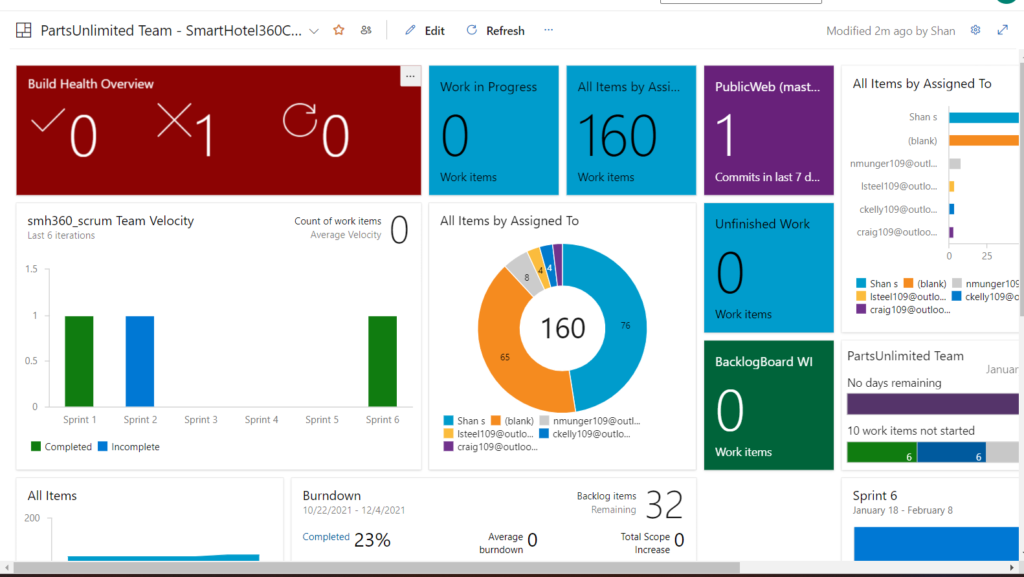
In a Dashboard, you can add interactive charts, widgets and some in-context reports to know more about the latest progress of an Azure DevOps Project. A typical Azure DevOps Dashboard may look something like the one shown below and there are various widgets you can add as well as re-arrange in the dashboard to get the latest information

Widgets that can be used in Azure DevOps Dashboards
- Action Button Widget
- Assigned to Me
- Build Health Details
- Build Health Overview
- Build History
- Burn Down
- Burn Up
- Chart for TestPlans
- Chart for WorkItems
- Code Tile
- Cumulative Flow Diagram
- Cycle Time
- Deployment Status
- Embedded WebPage
- Lead Time
- MarkDown
- New WorkItem
- Other Links
- Pull Requests
- Pull Requests – Multiple Repos
- Query Results
- Query Tile
- Release Health Details
- Release Health Overview
- Release Pipeline Overview
- Requirements Quality
- Sprint BurnDown
- Sprint Capacity
- Sprint Overview
- Team Members
- Test Results Trends
- Velocity
- WorkLinks
These are list of Widgets that are available by default in Azure DevOps Dashboard and there are many more widgets that are available from the marketplace which can be used to display in the Dashboard. In addition that we can also copy and rename a Dashboard in Azure DevOps
