LeadTime Chart in Azure DevOps Dashboard
Dashboards also has a Lead Time Widget which would display the time taken by the team to complete User Stories or Features or Epics. There are different ways in which you can configure the widget based on how you want to display the data for different teams.
Lead Time is defined as the time taken for a user story or feature from Active to Done state (In other words, Lead Time is actual time taken to complete a user story once the Developer or someone starts working on the user story). Let us see how to configure the Lead Time Widget in Azure DevOps Dashboard
-
Go to Dashboards and Click on Edit

-
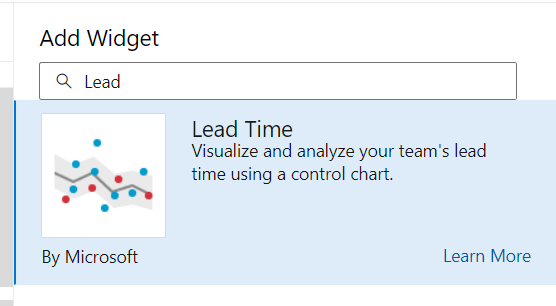
In in add widgets, search for “Lead Time” and then select the “Lead Time” widget and click on “Add” at the bottom

-
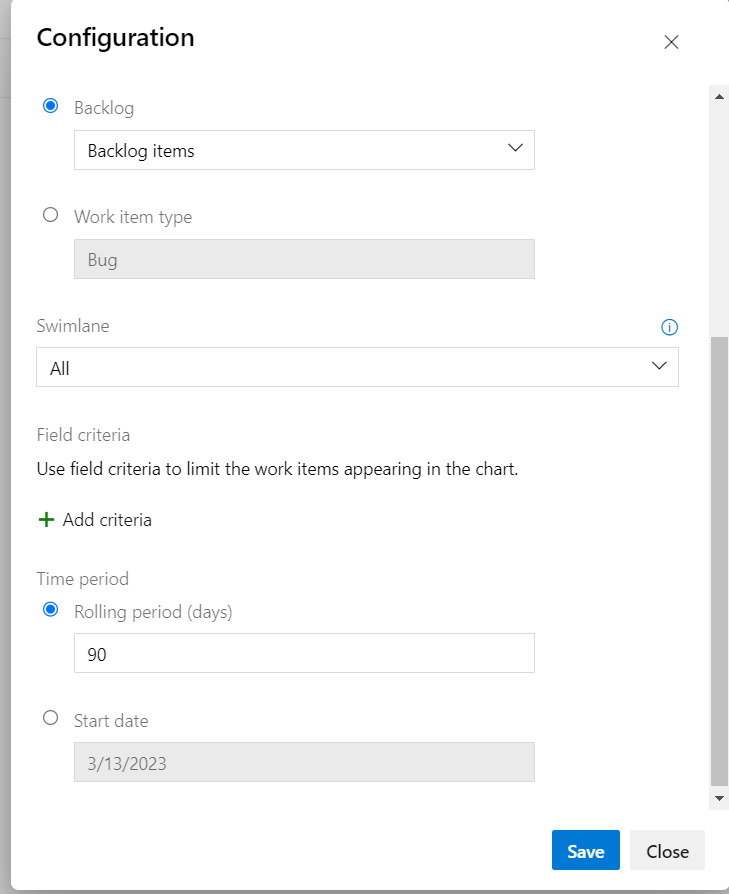
There are different configurations you can choose from, you can choose a specific worktime type or choose the entire backlog and you can have the time period as either 30 or 60 or 90 days (Maximum is 180 days) or you can just select start date and then click on “Save”

-
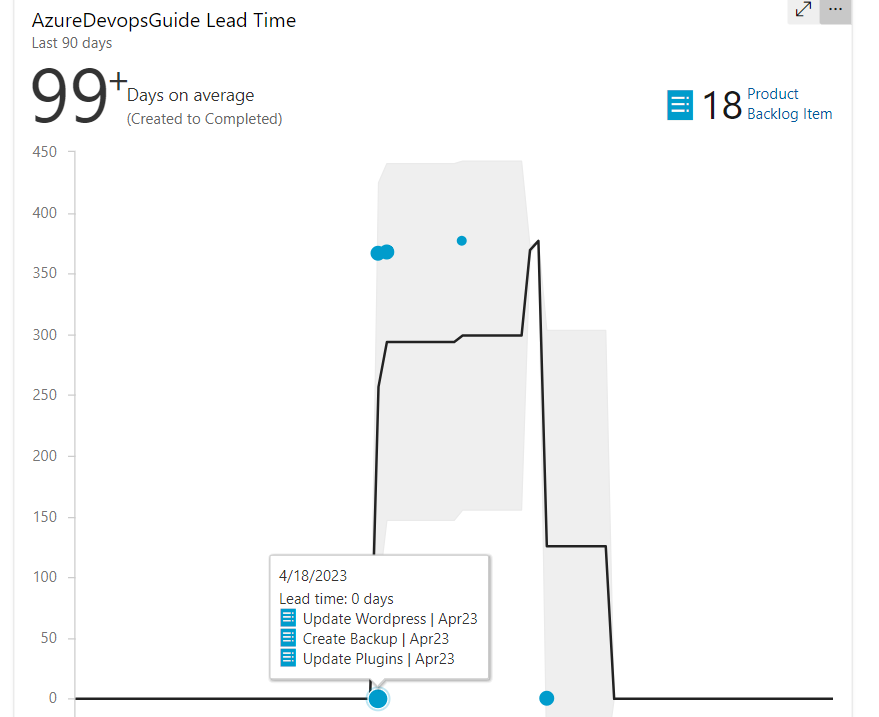
Once you have clicked on “Save” in the above step, the widget will display a chart as shown below. On the left side, the widget would be display average days taken to complete a backlog item whereas on the right side it will show the total backlog items that are included for displaying this chart

-
And if you hover your mouse over any of these values, it will show the Lead time for the completed backlog items as shown in the above screenshot.
