Multiple Projects Dashboard in Azure DevOps
Though Azure DevOps doesn’t have a feature to see data from multiple projects in a single Dashboards, there are some workarounds which can be done to see these data from different projects in a single Azure DevOps Dashboard.But this will limit us only to certain widgets we can use in the Dashboard DevOps.
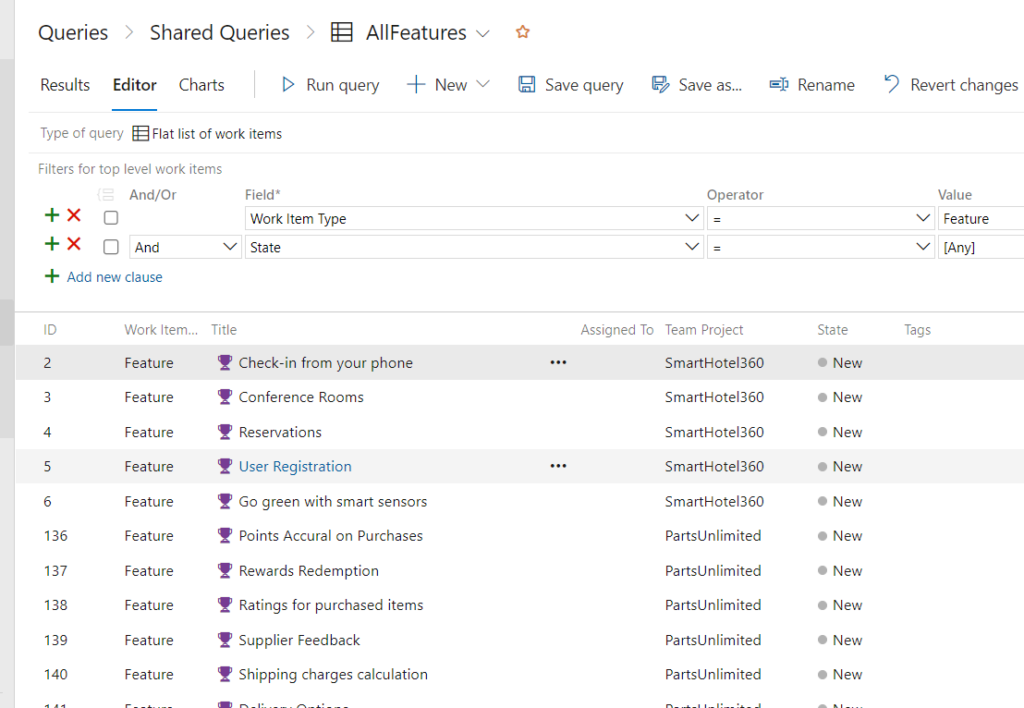
One good way to getting data from multiple projects to display it in different dashboards is by using query tile or charts which involves queries. For example create a query for features and choose the option as “Query across Projects” and then save the query as “AllFeatures”.

Also edit the query in way such that columns should display “Team Project” so that we can use the same data to display the charts in the dashboards for the same projects. (Make sure the data is displayed in the queries also_


Then in the dashboard, configure “Chart for Work Items” and choose “Chart Type” as “Stacked bar and choose “Group By” as project. This will allow you to display a chart or table that has values for both the projects


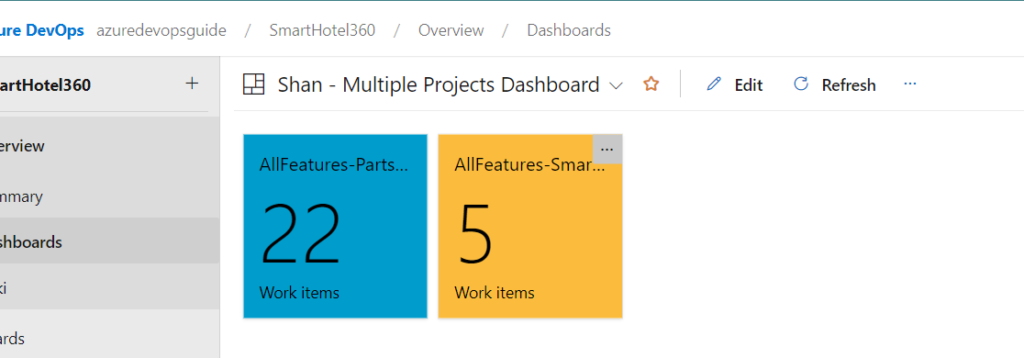
Similarly we can create different queries and display Query Tiles or Code Tiles for different projects in a single Azure DevOps Dashboard (Like shown below where I am able to display data for both

